Skip to collection list
Skip to video grid
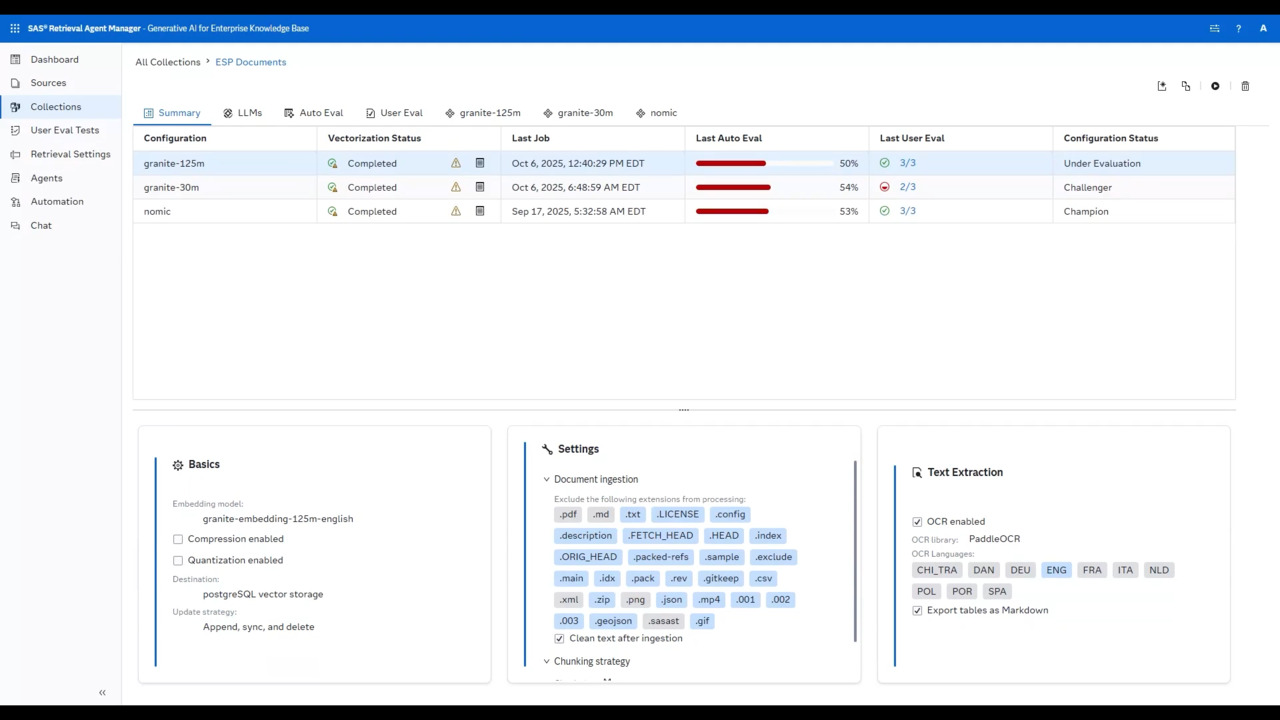
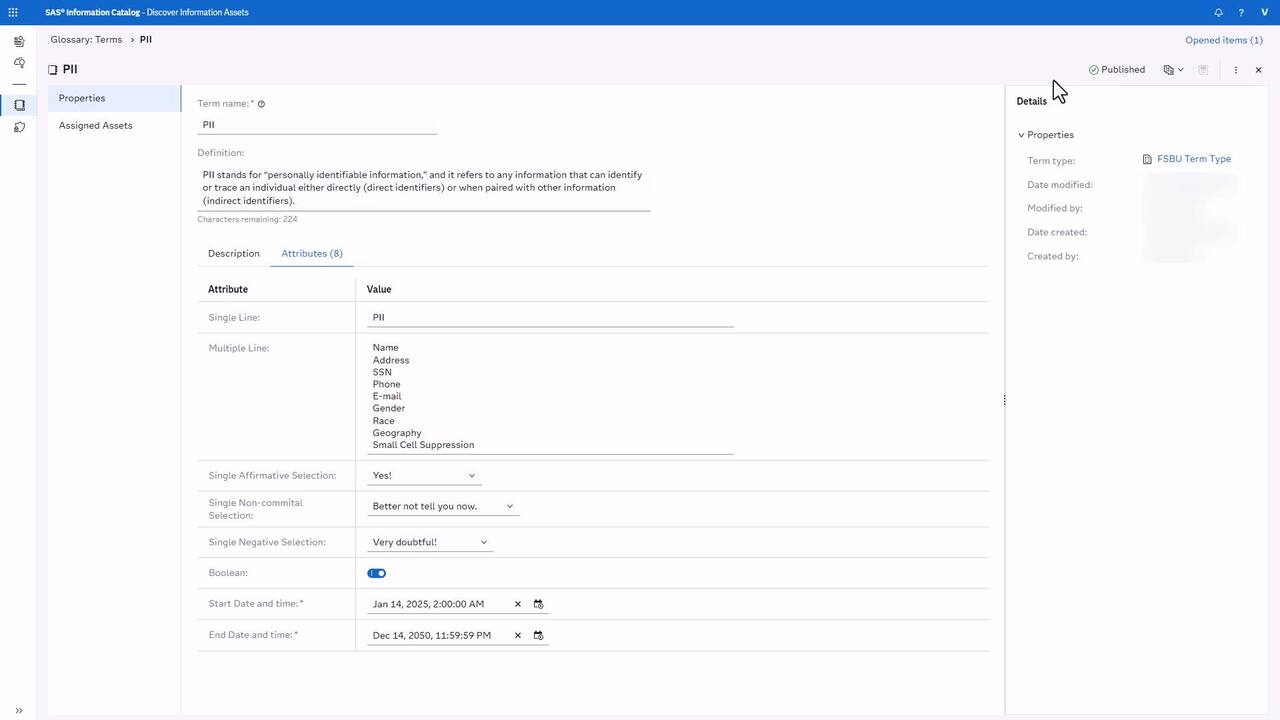
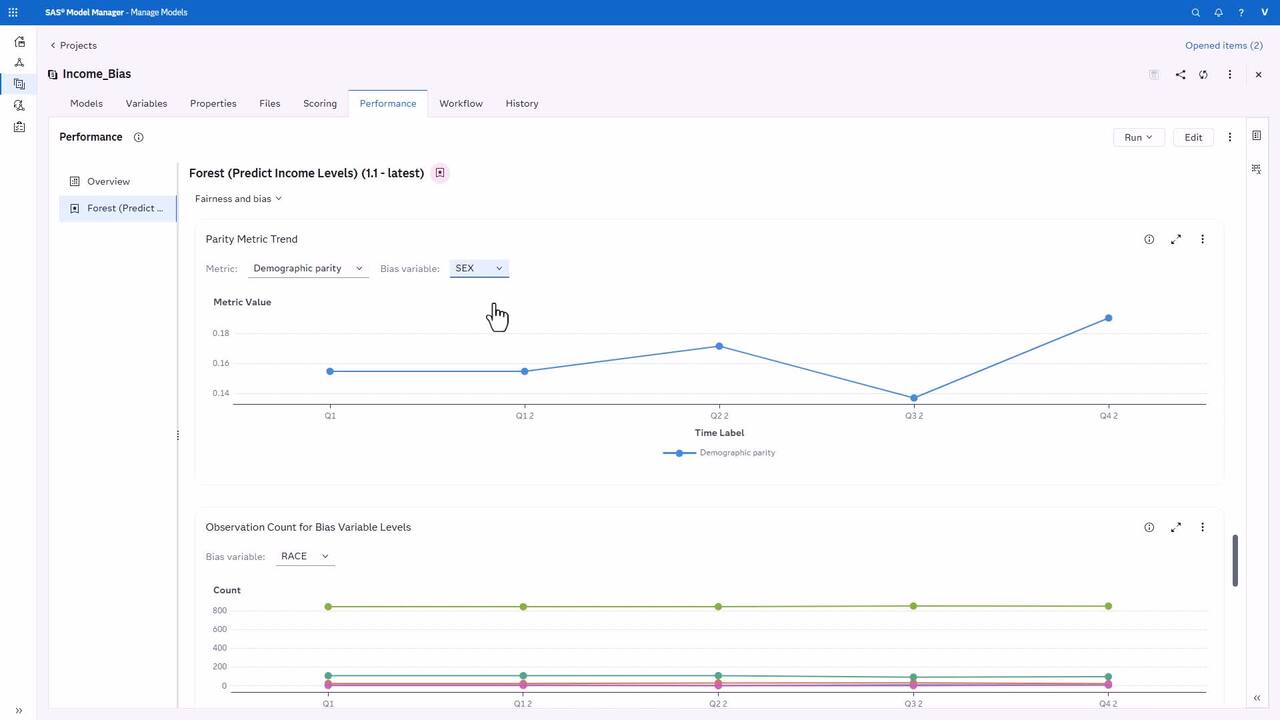
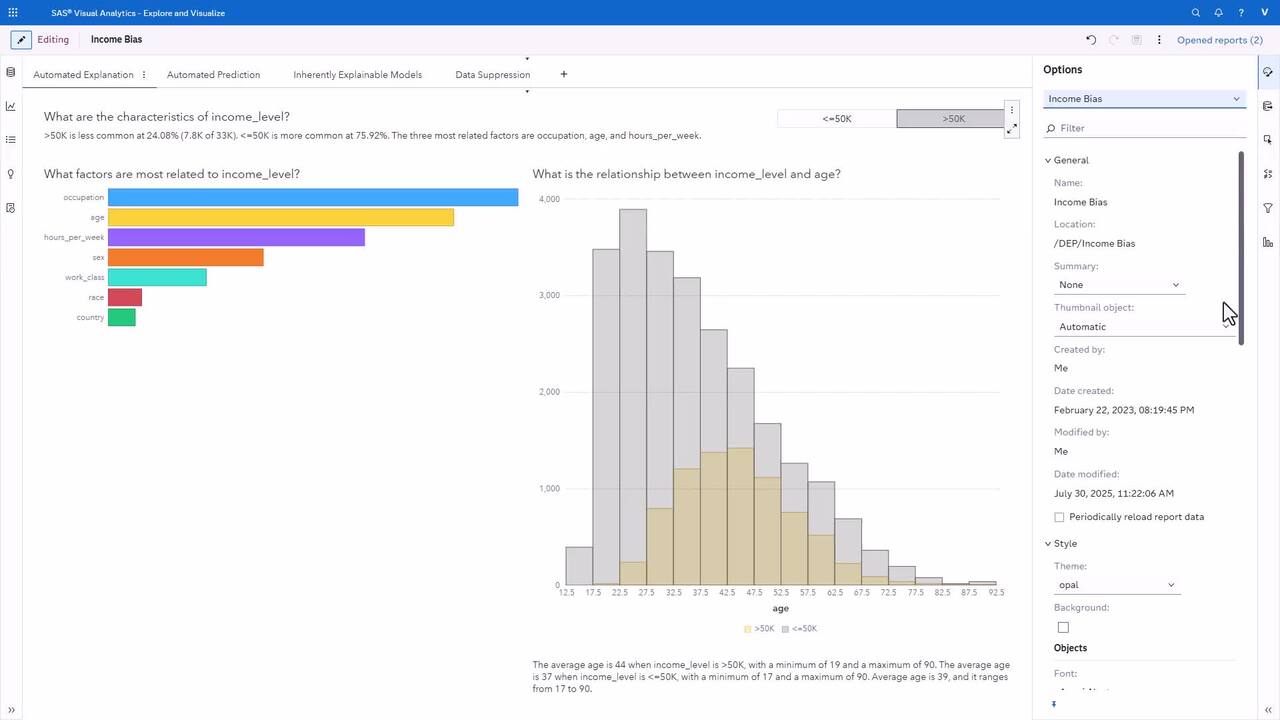
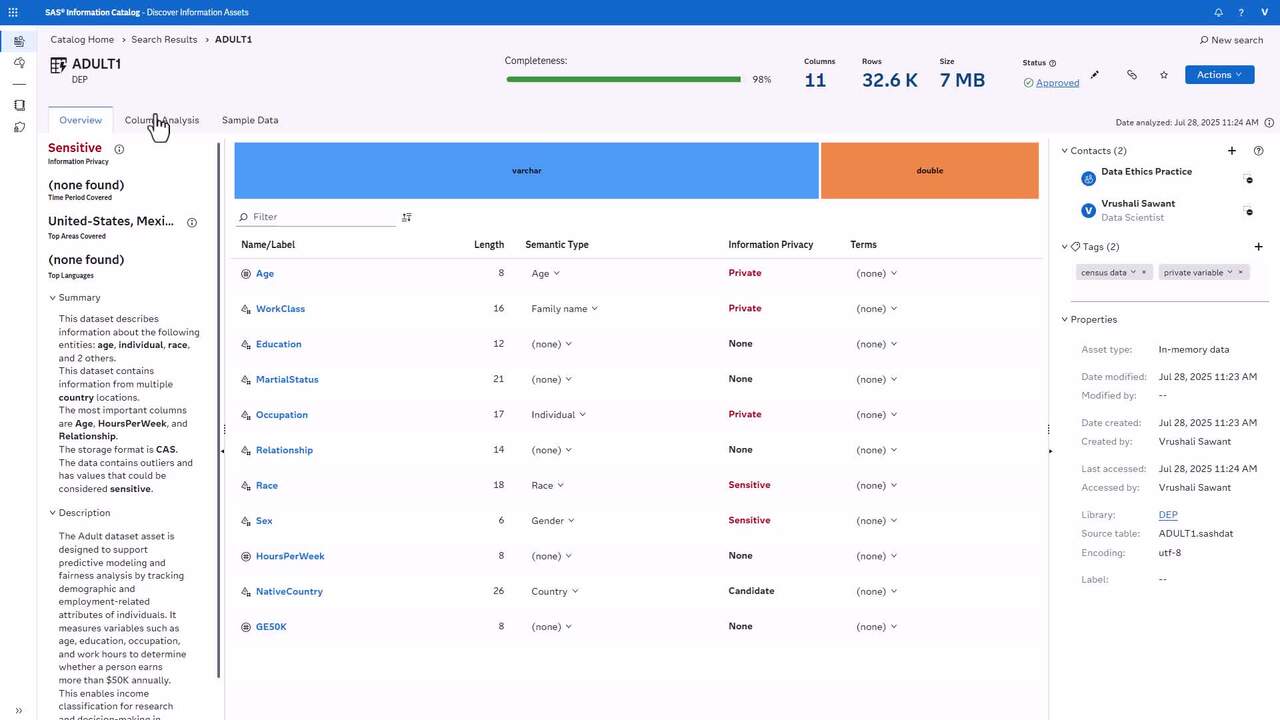
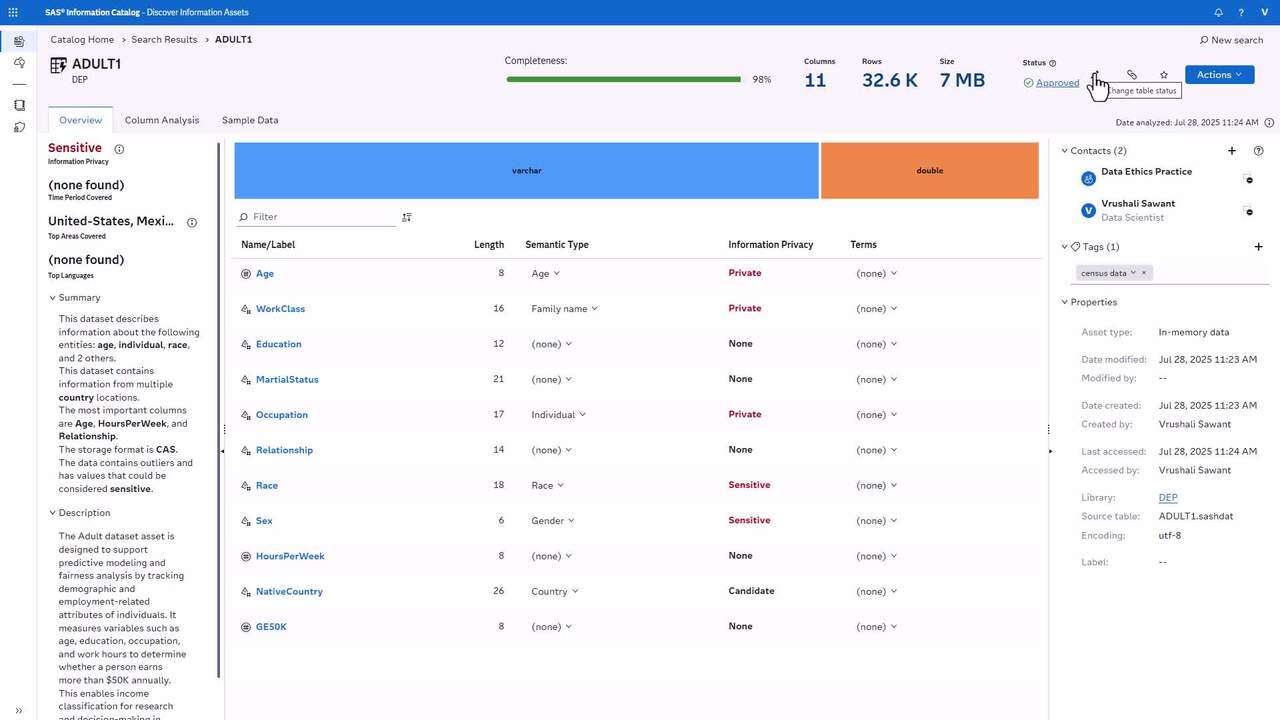
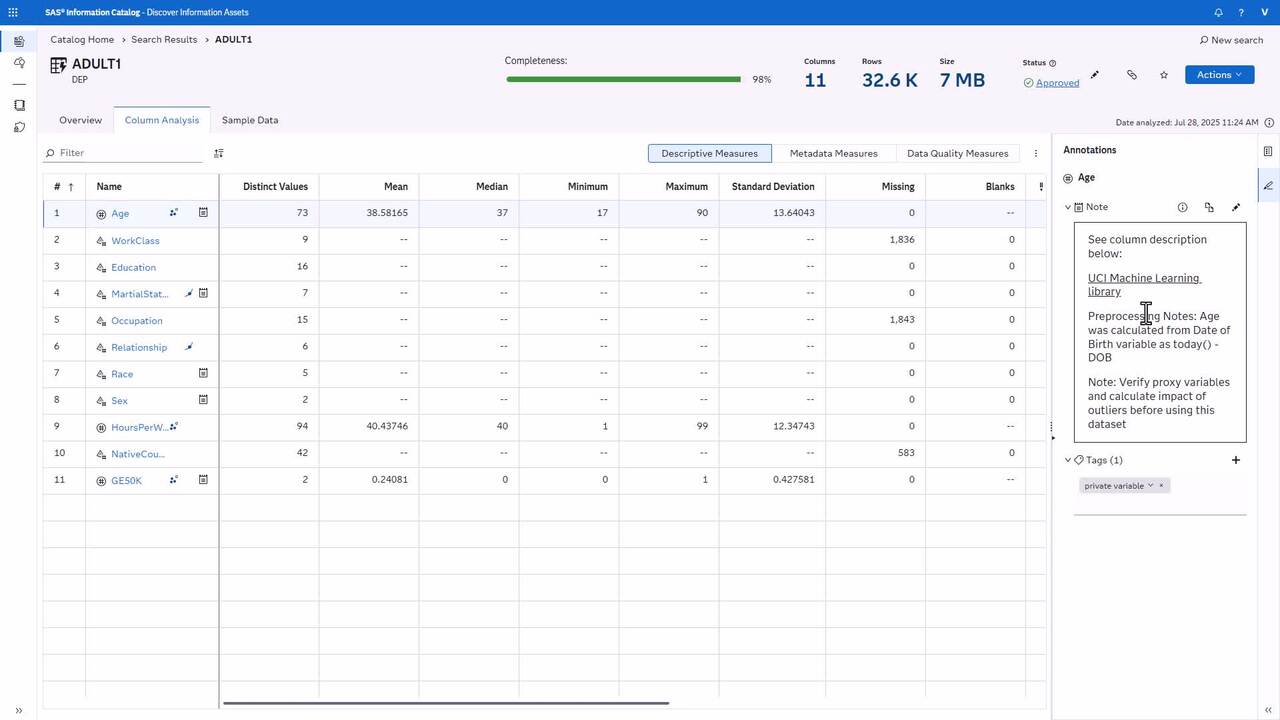
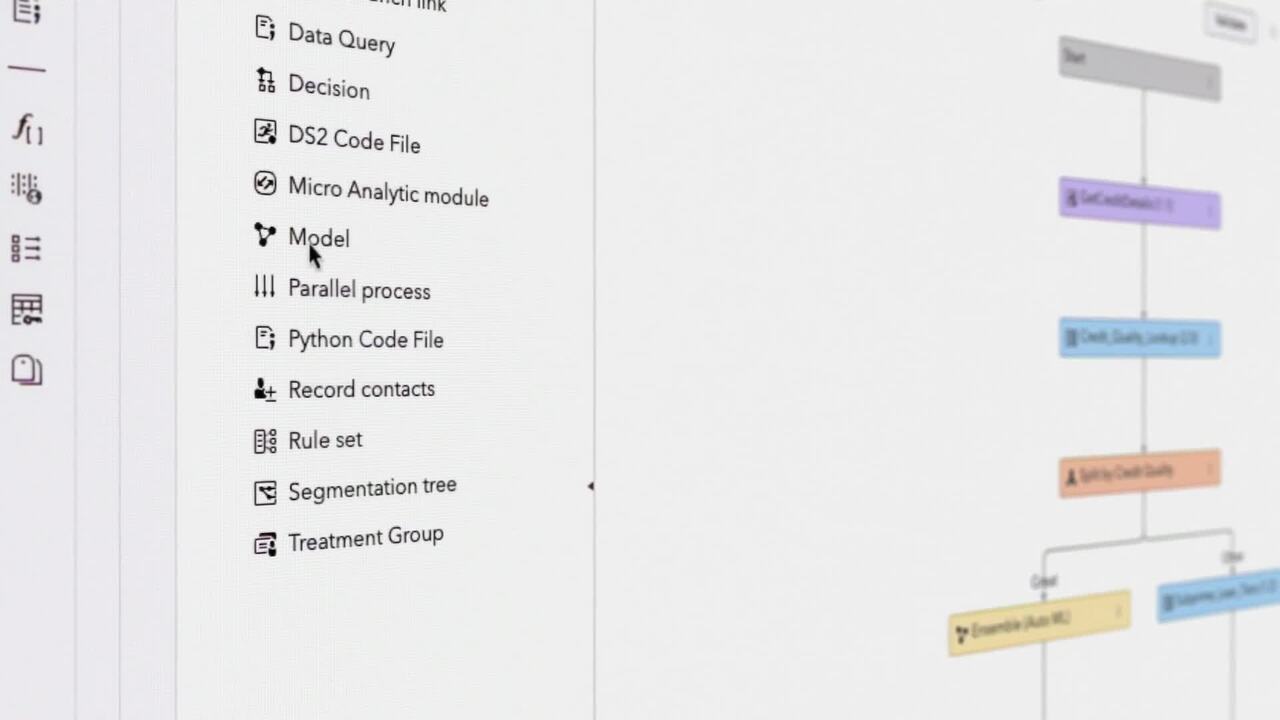
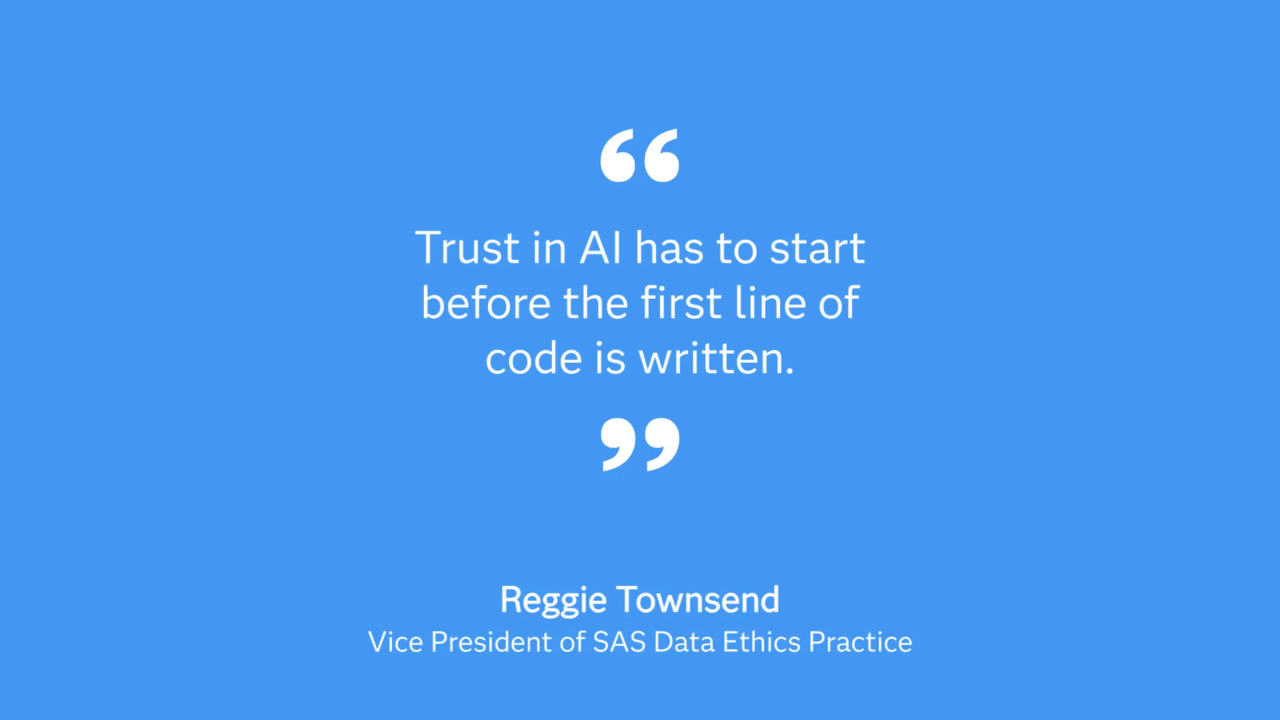
Trustworthy AI
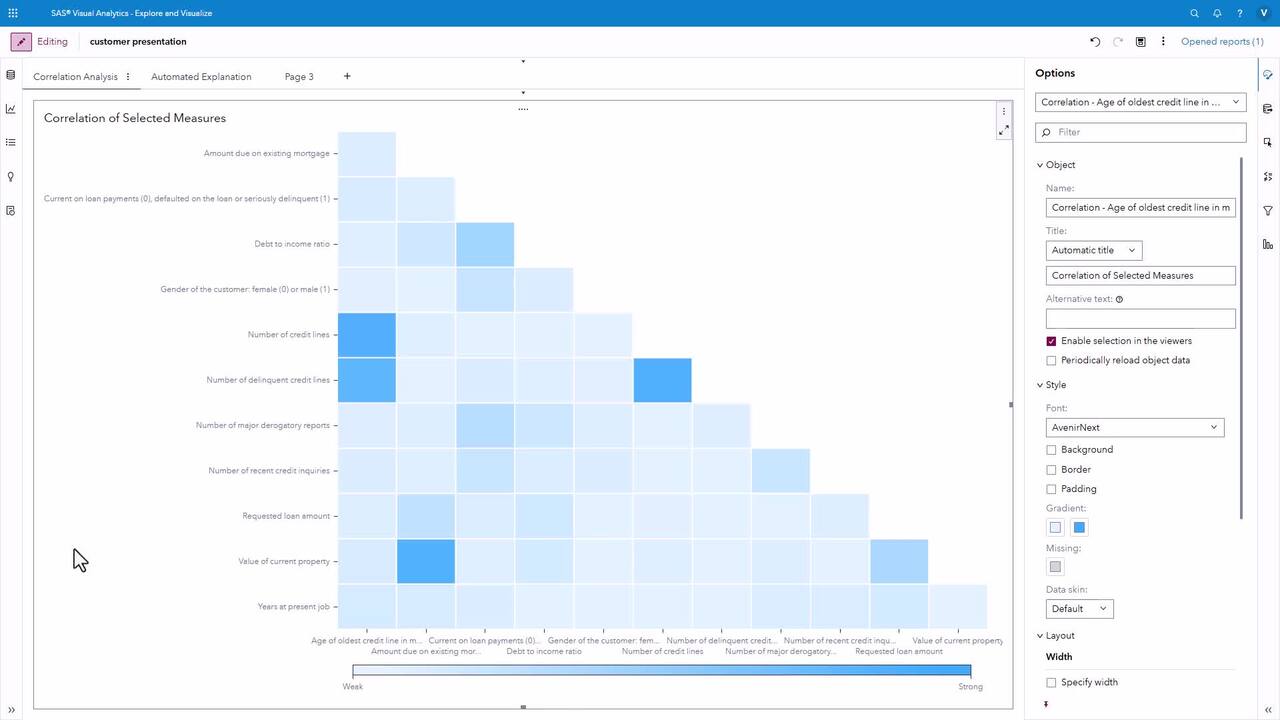
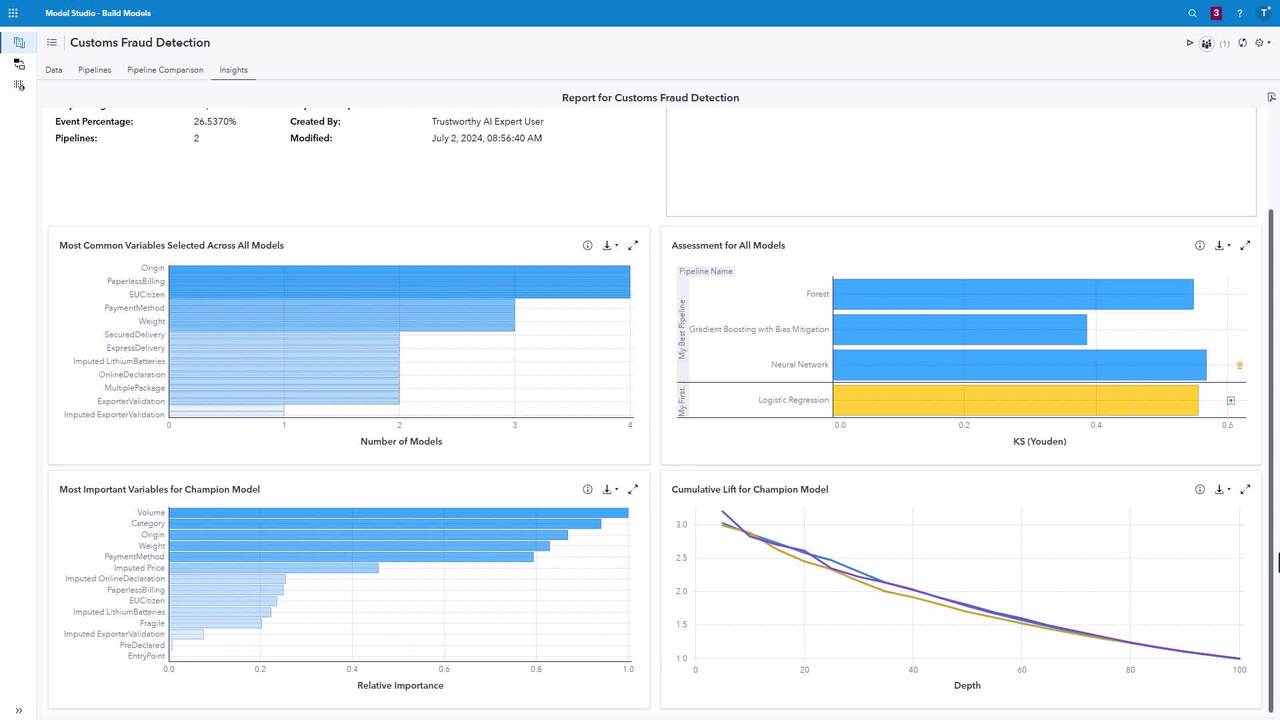
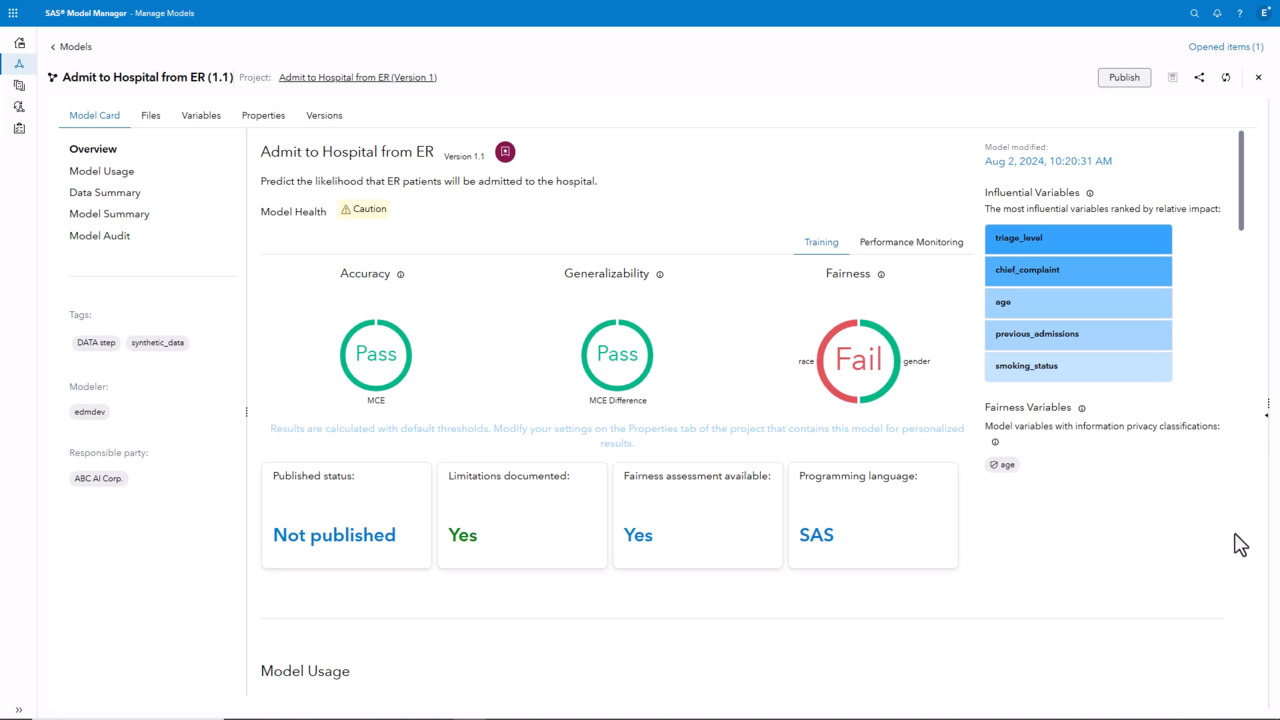
Natural Language Insights | SAS Viya Trustworthy AI Features
Learn how SAS Visual Analytics automatically generates graphical insights about data and models which can help explain the insights for any audience to understand
Read More
Read Less
categories
View more in
Currently loaded videos are 1 through 15 of 26 total videos.
First page loaded, no previous page available
Load Next Page
Sort By:
Sort By:
Most Recent